
Plan Usage
Click Plan Usage tab from the Starlink screen to open the plan usage screen.
In the Organization field, select the Organization or sub-organization from the dropdown menu. The logged in admin Organization is populated by default here. This is the organization corresponding to the email ID used to login.
The dropdown list consists of all the sub-organizations under logged in admin organization.
The Plan Usage screen enables the user to view the data consumption of all the standard and pooled plans associated with the selected organization, the data consumed by their sub-pools, the breakdown of Standard, Non billable and Opt-In Priority data consumed, the list of service lines associated with the organization and their individual data usage.
-20250424-105356.png?inst-v=fc2ec569-831b-4657-aec6-9d75d3f0693b)
Plan Usage
Select the Standard button located at the top of the charts to display usage data specific to the Standard data category.
Select the Total Usage button located at the top of the charts to display usage data including the Priority data category.
The headers show the following information:
Total Usage - The total amount of data consumed by the selected organization or sub-organization through their Starlink User Terminals.
Organization - The number of organizations associated with the pools and plans.
Service Lines - The number of service lines associated with the selected organization.
Graphs
The Graphs section displays all Pooled Plans and Standard Plans created under the selected organization, along with the number of Service Lines associated with each plan and the Usage/Quota of the plans.
The table shows the following information:
Plan - Name of the plan
Organization - The number of organizations associated with the pool/plan
Service Lines - The number of service lines associated with the pool/plan
Usage/Size - Data consumed through the pool/plan
Select the Pool/Plan from the left window and the charts of the selected entry will be populated on the right.
The first chart shows the data consumption through all the sub pools of the selected main pool.
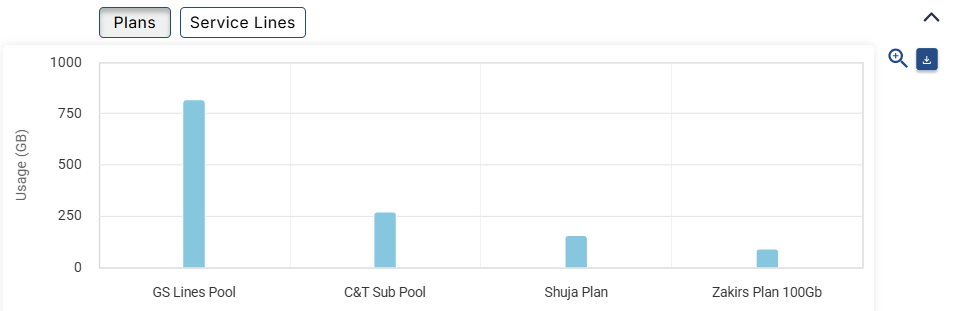
Plan Chart
The horizontal axis contains the names of the sub pools under the selected main pool and the vertical axis contains the data usage in GB.
The graph between these two axes gives the user a clear understanding of how the data has been used between the sub pools. The time period is from Plan start date to till date.
The second chart shows the data consumption based on the category of the plan - Standard, Non Billable, Opt-In Priority, Priority.
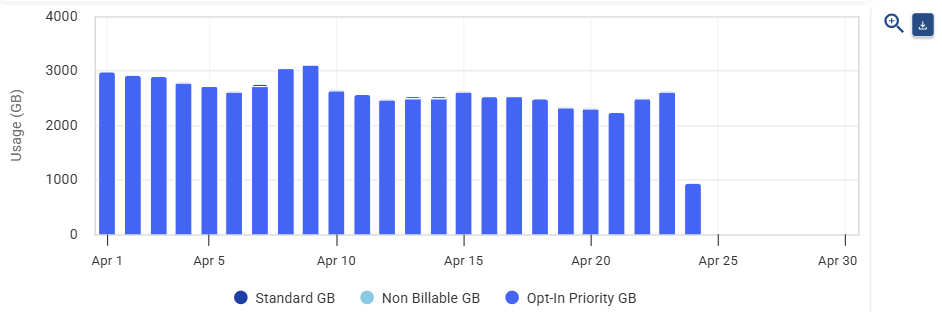
Plan category Chart
The horizontal axis contains the dates and the vertical axis contains the data usage in GB.
The graph between these two axes gives the user a clear understanding of how the data has been used based on the category of the plan.
Hover the cursor at any point on the chart to view the breakdown of the amount of data used.
Select the Service Lines button at the top of the chart to view the chart based on the service lines.
Now the first chart shows the data consumption through all the service lines associated with the selected pool.
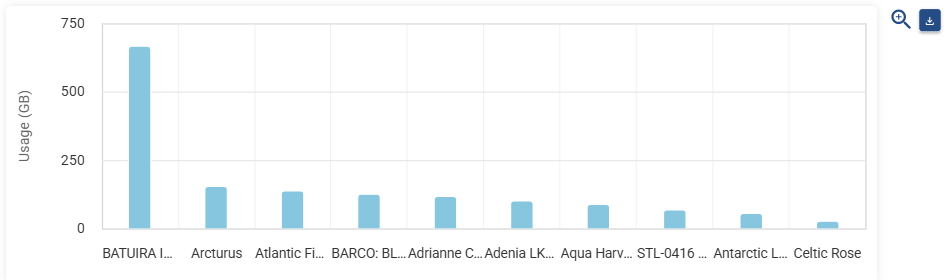
Service Line Chart
The horizontal axis contains the names of the service lines associated with the selected pool and the vertical axis contains the data usage in GB.
The graph between these two axes gives the user a clear understanding of how the data has been used by the service lines. The time period is from Plan start date to till date.
Click the
 icon to view the chart in full screen.
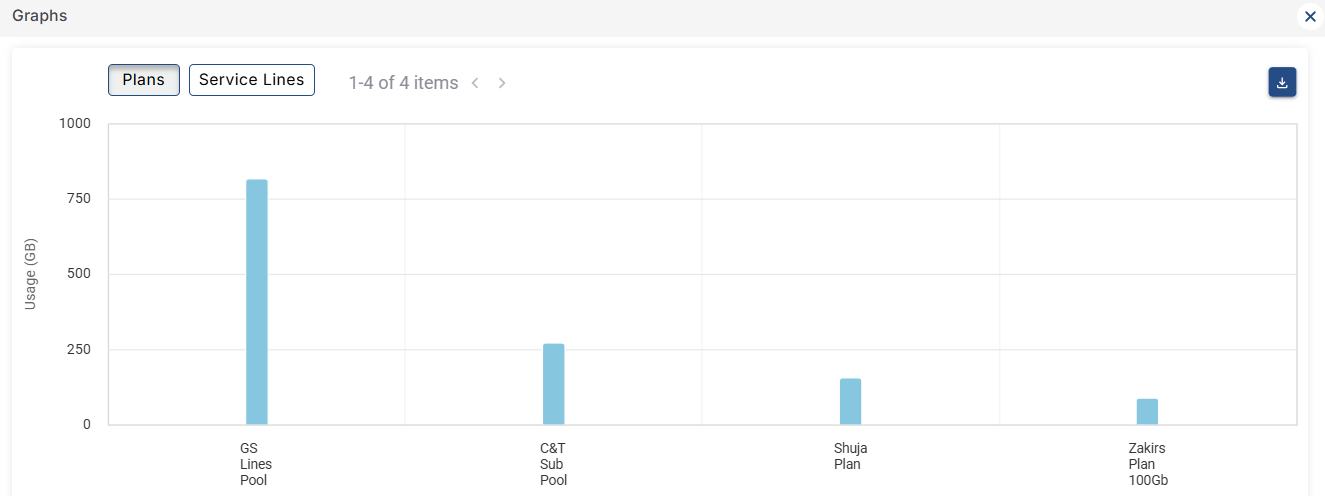
Full Screen Chart
Click the
 icon to download to download the chart locally.
Service Lines
The Service Lines table shows the list of all service lines associated with the selected organization.
-20250424-120151.png?inst-v=fc2ec569-831b-4657-aec6-9d75d3f0693b)
Service Lines
The table shows the following information:
Service Line - Name of the service line
Status - Shows the status of mobile priority and Starlink subscription
Organization - Name of the organization
Sub Organization - Name of the sub organization
Plan - Name of the plan associated with the service line
Billing Usage - The amount of data used by the service line and the percentage out of total quota
Billing Date - The billing start date
Site - Name of the site
Actions -
Click
 icon to set/edit the availability alert.
The Service Line field is auto populated.
In the Alert if offline for field, set the time period after which the alert should be raised.
In the Notification section, select the checkbox of medium to send the notification. The options available are Email and Microsoft Teams.
In the Send To (Via Email) field, select the Email address from the dropdown menu or enter a new email address.
Click Save.
Now when the service remains offline for the specified amount of time, a notification will be sent to the given Email address and the Teams channel stating details about it.
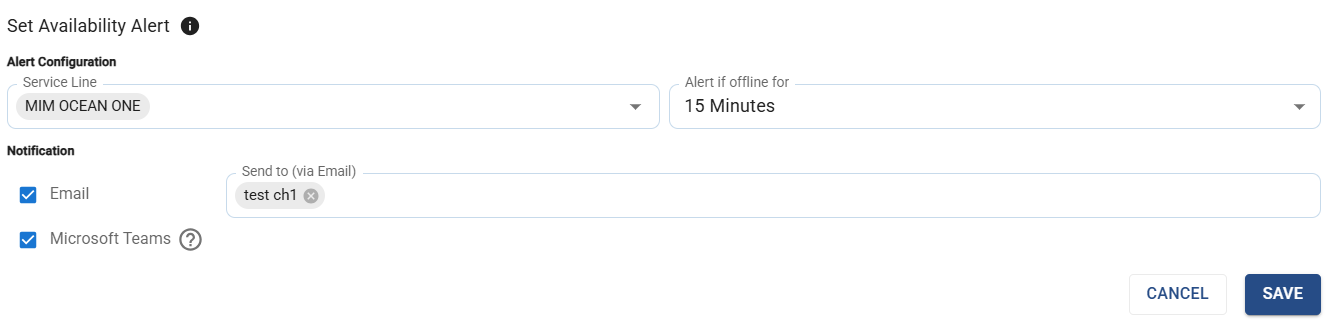
Availability Alert