
Dashboard
Dashboard is the landing page post user credentials validation. This screen provides a quick view of the status of the Interfaces, Network Usage across Access Networks, Active Networks and Active Devices.
-20250305-164643.png?inst-v=fc2ec569-831b-4657-aec6-9d75d3f0693b)
Dashboard
This screen is also called the Internet Status screen.
The Title bar shows the Site Name, Device Name, Time zone of the user, Username and the Alerts icon.
Selecting the Time zone
The user can select the Time zone to access the details on this screen based on the selected time zone.
By default, the UTC time zone is configured.
The user can select any time zone from the following options:
UTC
EST
CST
MST
PST
AST (Atlantic)
HST (Hawaii)
CET (Central Europe)
EET (Eastern Europe)
WET (Western Europe)
BST
UAET (United Arab Emirates)
SGT
NZST
IST
Internet Status Panel - Viewing Interfaces Status
The user can view the Internet Status of all the interfaces available in the system on the Internet Status panel.
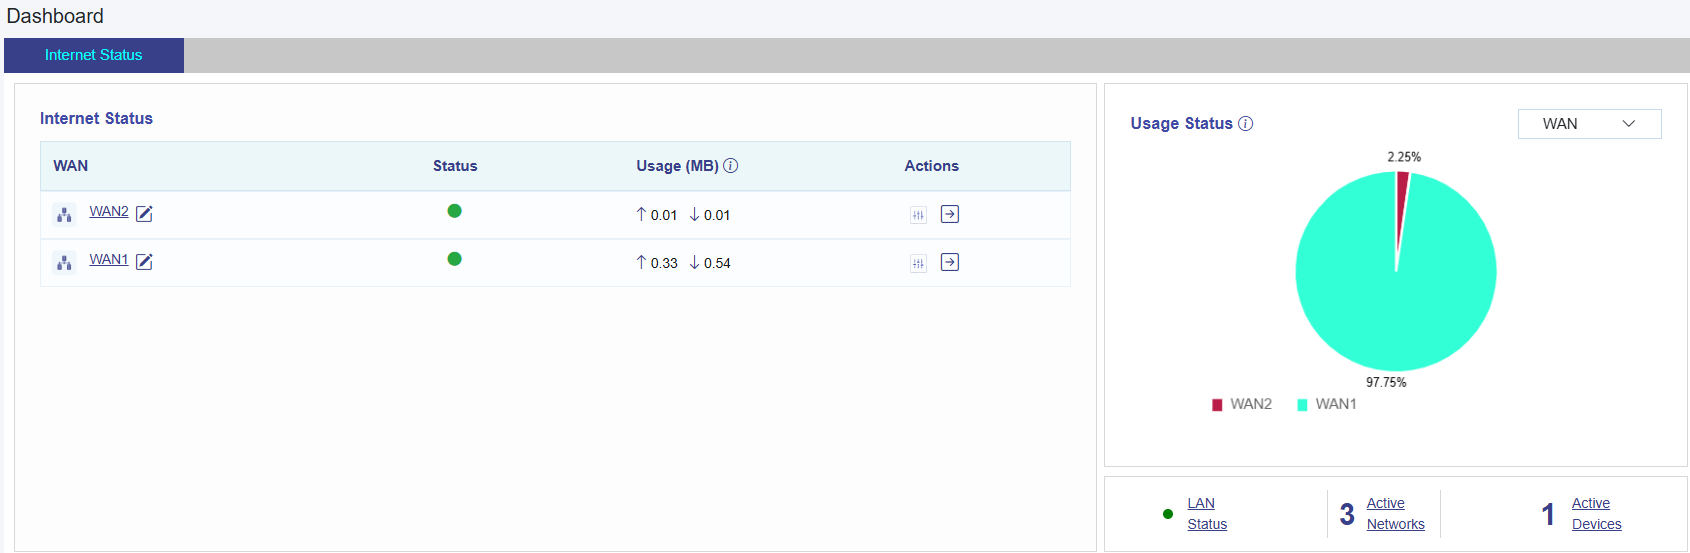
Internet Status
Fields | Description | Configuration |
WAN | Displays the name of the Interface. | To view details of the Interface, Click on the Interface. The user will be routed to the respective Controller page or the modem. |
Status | Displays the status of the Interface. the status indicators are explained below:
| N/A |
Usage (MB) | Displays the upload and download data usage on the interface. | N/A |
Actions | There are five action buttons available per interface for the following actions.
|
Viewing Controllers
To view the Controller for the Interface, perform the following steps.
Click Interface
icon under the Actions column corresponding to the WAN source. The Controller page appears.
Viewing Performance Chart for an Interface
To go to the Performance Chart for an Interface, perform the following steps.
Click the Arrow icon Action corresponding to the Interface. The user will be directed to the corresponding interfaces’ Performance Chart Screen, see figure below.
**add screenshot here**
Usage Status
This Usage Status panel depicts the percentage of usage per Interface.
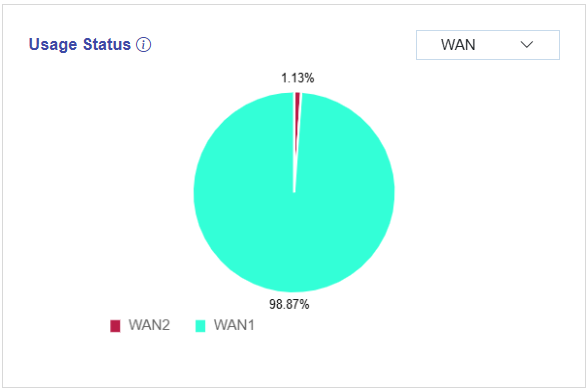
Usage Status
The user can also view the percentage of usage per WAN Type or per Access Network for a given period. Select the required type of filter from the dropdown menu to view the usage breakdown.
Viewing Usage for an Interface
To see the % usage for an Interface across different Access Networks, perform the following steps.
Click the drop down on the top right of this section and select the Interface, Figure Network Usage Drop-Down Selection.
The pie chart updates with the details, see Figure Starlink Network Usage.
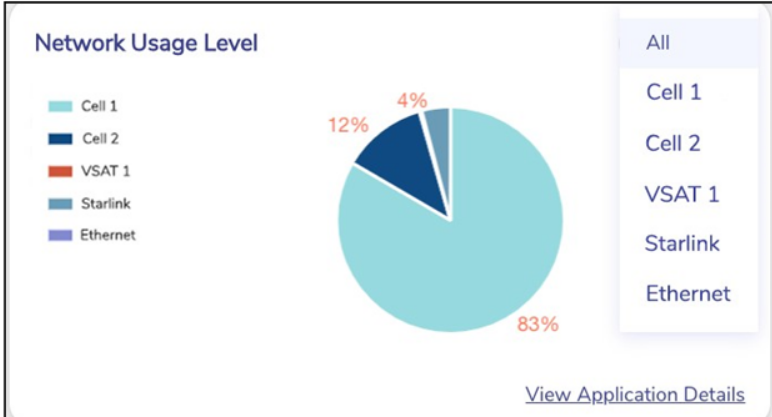
Network Usage Drop-Down Selection
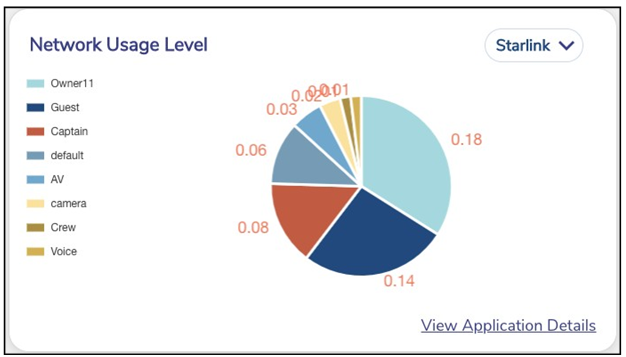
Starlink Network Usage
LAN Status
The LAN Status panel provides the status of the LAN, Active Networks and Active Devices in the system.
For details of the fields, see table below.
Fields | Description | Configuration |
LAN Status | Displays LAN Status on the server.
| Click on LAN Status to go to Access Network Screen. |
Active Networks | Displays the total active networks in the system. | Click on Active Networks to go to Tope Networks section of the Usage Screen. |
Active Devices | Displays the total active devices. | Click on Active Devices to go to Top Devices section of the Usage Screen. |
Table LAN Status Fields